President-elect Donald Trump’s victory in the 2024 presidential election was the result of demographic shifts that benefited Republicans.
Exit polling by Edison showed that Americans were more similar in their voting patterns this cycle than they were divided—the expected wide gaps based on gender, education, age, and race between Republicans and Democrats failed to materialize.
Trump ultimately was able to narrow these gaps vastly compared to 2020, concentrating on economic messaging that was compelling to a broad cross section of American political society.
Currently, the president-elect is projected to have carried all seven of the core swing states, bringing him up to a total of 312 electoral votes to Vice President Kamala Harris’s 226.
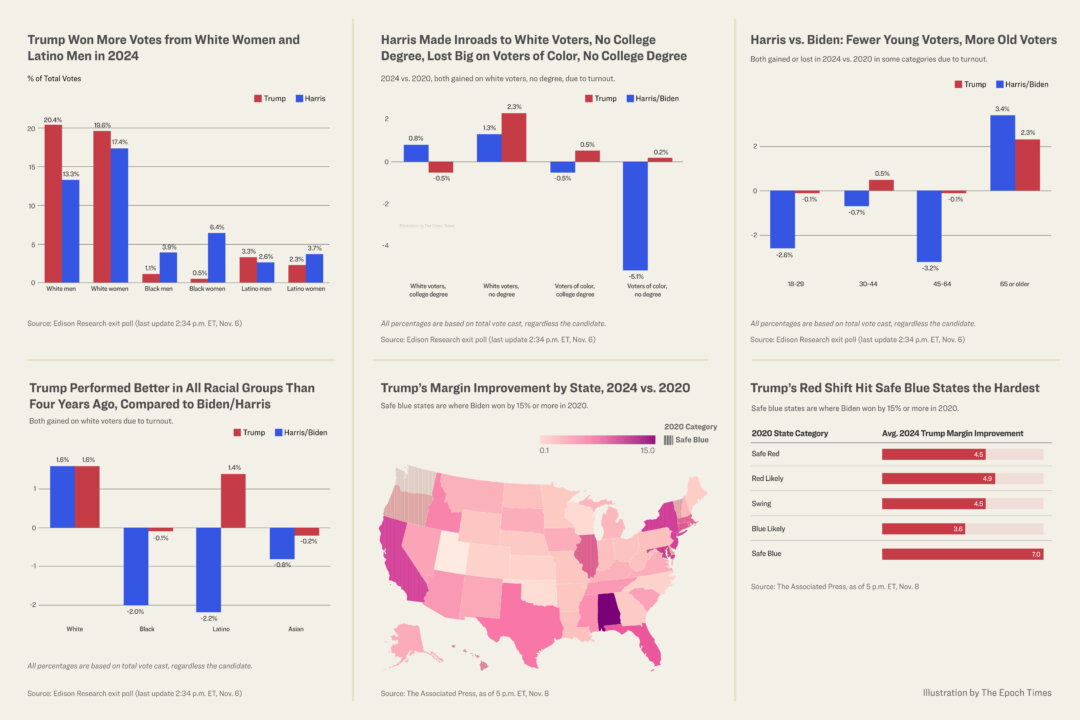
These charts show the shifts that gave Trump a second, nonconsecutive term in the White House.
Gender
This campaign season was unusually gendered in each campaign’s strategy.
Harris sought to target female voters, using the issue of abortion as a rallying point. Trump focused more on male voters, particularly young men, and appeared on podcasts popular with the demographic.
Thus, observers expected a substantial gender divergence that, ultimately, didn’t materialize.
In reality, Trump outperformed among both men and women, winning white men, white women, and Hispanic men outright and increasing his share among black men and Hispanics.

Education
Democrats have gained ground among wealthy, white, college-educated voters in recent years, and those trends continued in 2024.
This cycle, Harris gained among white college-educated voters, winning 17.2 percent of total votes cast for the presidential election from the group. President Joe Biden received 16.3 percent of his votes from the group in 2020, a 0.8 point shift. That’s unsurprising, as Harris targeted these voters.
Trump has also made gains for the GOP among non-college educated voters across racial groups.
Technically, Trump also lost a point of support from white non-college educated voters compared to 2020, though that’s within the exit poll’s margin of error.
But where he lost some among white voters, he gained among minority voters, including both those with and without college degrees.

Age
Traditionally, young people tend toward Democrats and older people veer more Republican.
That standard wisdom, however, was flipped on its head in this election: Harris underperformed with young voters, meaning those aged 18 to 29.
While Trump managed to win 18- to 24-year-old voters outright, 25- to 29-year-olds slightly favored Harris, bringing Trump’s total with the group to 43 percent—an increase of 7 percent compared to 2020.
At the same time, Harris made gains with older voters, winning voters aged 65 and older outright. The oldest voters reduced their support for Trump by around 3 percent, with 45 percent supporting the president-elect this cycle.

Race
Likewise, the Democratic coalition has historically relied on minority voters as a counterbalance to Republican-leaning white voters.
In this election, Trump again won among white voters outright, which was crucial to his sweeping victory, as the group made up nearly 71 percent of the electorate. White voters backing Trump accounted for 40.5 percent of the electorate versus Harris’s 29.1 percent.
However, Trump also made crucial inroads with other racial groups.
His vote share among blacks nudged up 1 percent in 2024 versus 2020, driven largely by shifts among black men.
Shifts were more pronounced among Hispanic voters, with whom Trump saw an increase of 14 percent compared to 2020, falling just shy of a majority with the demographic. That shift enabled Trump to drastically increase his vote share in states such as Florida and Texas, which he won by more than 10 points for the first time in his political career.
The same trend was viewed among Asian voters, with Trump winning 39 percent of the demographic, marking a 5 percent increase over 2020.

Trump Gains in All States
These demographic shifts enabled Trump to increase his margins in every single U.S. state.
Aside from enabling a sweep of all seven swing states, the shifting political alignments also saw Trump make gains in dark red and deep blue states alike.
For instance, in Florida and Ohio—once the quintessential swing-states—Trump won by a more than 10 percent margin, the first time any candidate has pulled off such a feat since President Ronald Reagan’s 1984 electoral landslide victory.
Swing states, by comparison, shifted less than states that were firmly in the GOP camp or the Democratic camp.
The chart below shows how these shifts played out.
Blue States Shifted Most
Surprisingly, states that were safely blue in 2020—those that voted for Biden by a margin of 15 percent or more—shifted the most in Trump’s favor.
Across safe blue states, Trump gained on average 7 percentage points.
That shift was most visible in New York, New Jersey, and Illinois.
New York shifted a sizable 12 percent in Trump’s favor, with Harris barely holding on to double-digit margins in the state at just 11 percent over her Republican challenger. In 2020, Biden won the state by 23 points.
Illinois, a 17 percent victory for Democrats in 2020, shifted 9 points to the right, voting for Harris by just an 8 percent margin.
But nowhere were these shifts more visible than New Jersey, which Biden won by 16 percent in 2020; this year, Harris eked out a 5 percent margin win—such a small margin that it places the state firmly in potential swing-state territory in 2028.
Red states also saw shifts, but these were less pronounced than in safe blue states.
In the chart below, we define safe states as those with a margin of 15 percent or more in 2020, likely states between 5 and 15 percent, and swing states within 5 percent. In addition to the swing states in 2024, Florida is also considered a swing state in our analysis due to the 3.3 percent margin in 2020 election results.


